
The Income Statement or Profit & Loss measures brewery financial performance over a period of time. The results are usually presented in a month-to-date and year-to-date format, and show comparisons to budget or prior year activity.
But what exactly should your brewery P&L look like?
In other words, what numbers should you expect to see? How do your numbers compare with what other breweries are doing?
In this post, we’ll give answers to these questions and include a brewery P&L spreadsheet template to track and compare your financial results.
Income Statement Basics + The Simple Brewery P&L
The income statement measures sales, cost of sales, gross profit, operating expenses and net income (or loss). The statement may include lots of detailed accounts and run many pages in length.
Alternatively, the income statement can provide just a summary of the key financial information. See the example below.
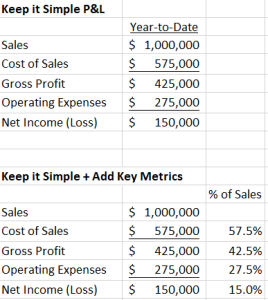
In the example above, the P&L is summarized to just five lines of information. With this approach you can see in just a few seconds how your brewery is performing.
Percentages are included on this simple P&L to make reading and understanding the results easier. Once you determine expected cost of sales, gross profit and operating expenses as a percentage of sales, you can quickly see where you stand in relation to your financial goals.
Brewery Income Statements + More Detail
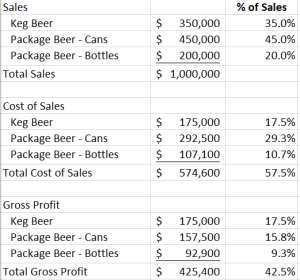
Once the Simple P&L becomes a little too simple, you can graduate to more detail on the statement. See the example P&L below.
Benchmarks and KPIs
So what brewery financial benchmarks should you use to compare against?
Cost of sales can range from 50% to 60% of revenues. This will depend on many factors – labor rates, brewery lease costs, raw ingredient costs, etc.
Gross profit may range from 40% to 50% of revenues. Again, many things will influence this number – the costs noted above, the selling price of your beer and the type of sales channels (taproom, distribution, self-distribution, etc).
Operating expenses are all over the map. The key here is to make sure these expenses are lower than gross profit as a percentage of sales. If gross profit is 40% and you want 15% net profit, the operating expenses need to be 25% of sales or lower.
Benchmark against your financial goals. Benchmark against your past performance. Use these numbers as general guidance and take them with a big grain of salt. Your own brewery performance is the best measurement to use for comparison.
Wrap Up + Action Items
Grab these Brewery Income Statement Templates
Input your numbers and compare to the benchmarks above. Compute your cost of sales, gross profit and operating expenses as a percentage of sales. It’s a new year and a new beginning for your financial statements. Use the templates to monitor financial results and make it the best year ever.
Yours in Simple P&Ls,
Kary