Brewbound recently ran this Craft Brewery Financial Training article on brewery metrics. Sharing it here in case you missed it.
How to Use Brewery Metrics to Improve Financial Results
Brewery metrics and key performance indicators are used to benchmark and compare financial performance so that you can increase profitability and cash flow.
In this article, we’ll review commonly used brewery ratios and industry averages. We’ll explore how to calculate these metrics and build scorecards to present the information.
How do your financial results stack up against other breweries? How should you compare past historical performance against current results? Read on to find out.
Brewery Metrics + Best Practices
Before we dig into the numbers, let’s review some best practices for using brewery metrics. This will give you a starting point when it comes time to measure and monitor your own data.
- Use metrics to get results
- Measure what matters
- Beware the industry averages
No. 1 Use metrics to get results
The goal of using brewery metrics is to get results. Metrics should be used to help achieve a specific and measurable outcome that is meaningful to the business.
The desired results may be financial, operational, or customer service focused. Results may be related to safety, customer satisfaction, company culture, or any number of other important business outcomes.
Regardless of what the desired result is, the point is to have one. Be purposeful about what you want to measure and how the key metrics will help achieve the outcome you want.
No. 2 Measure what matters
Brewery software systems give us mountains of data on every aspect of the business. With so much information at our disposal, it’s tempting to create lots of brewery metrics just because we can. As a result, we end up measuring things that don’t matter and don’t make a material difference to the business.
Before creating your brewery metrics, put some thought into measuring the important stuff. Here are two questions to help identify metrics that matter:
What keeps you up at night?
For me, the answer is cash flow. More specifically, the thought of running out of cash keeps me up at night. So, I created metrics around company cash flow. I want to know the current and projected flows of cash, and whether we may have any shortfalls. I want to know what our borrowing capability is in the event we run into problems. I want to see these metrics on a regular basis because they provide answers that are meaningful to the business. And they help me sleep at night.
What keeps you up at night? The answer to this question is a great starting point to identify metrics that matter.
What is one problem you need to solve in the brewery?
You have at least one big problem you’ve been avoiding. That nagging issue you know needs to be addressed before it becomes a really big and expensive problem. Start by creating a metric to deal with the issue.
Maybe payroll is starting to get out of control or you are over committed on hop contracts. Problems are opportunities waiting to be solved, and metrics can help quantify a solution.
No. 3 Beware Industry Averages
Everyone loves industry averages. We want to know how our numbers compare to other breweries, and we believe industry averages hold the answers.
Are we better than average? Worse? Where are we falling short? How can we do better?
Unfortunately, most industry averages are based on a collection of breweries that bear no resemblance to our own. The markets or demographics that these other companies serve may be entirely different than ours, and therefore a comparison of our performance with theirs is not valid.
In my opinion, it’s far better to use your own brewery’s past performance as a benchmark for future improvement. Historical results in product margins, sales growth or bottom line profitability serve as a more valid basis of comparison.
Industry averages are interesting, but benchmarking against your own past performance will be far more useful. Bottom line, look at what you’ve done in the past and seek to improve upon your own track record.
Key Metrics: Income Statement
Time for the numbers. Let’s begin with simple and meaningful metrics that live on the income statement: Sales, Margins, Operating Expenses, Net Income and EBITDA (Earnings Before Interest, Taxes, Depreciation and Amortization).
To create income statement key metrics, start by summarizing the detailed financial information to one-page or less. For instance, use subtotals for sales, margins and operating expenses and ditch the details for now.
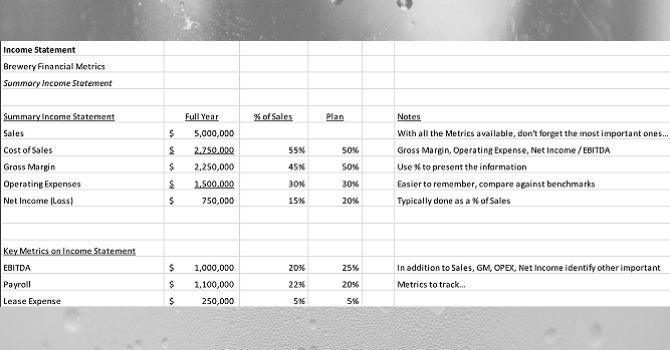
Next, calculate each line item as a percentage of sales, and include the planned results from the financial budget. Here’s an example:

This example shows a summarized income statement, with the cost of sales, margin, operating expenses and net income as a percentage of sales. Using percentages allows for a quick comparison to planned results. For example, Gross Margin is 45% of sales, but the Planned Gross Margin is 50%. It’s easy to see where the numbers are coming up short.
Additional key metrics can be added at the bottom of the summary income statement. In this example, EBITDA, Payroll Expense and Lease Expense are measured as a percentage of sales, and compared to the planned results. These are common metrics to measure, however, you can add other relevant metrics based on what’s most important to your brewery.
The simplified income statement makes it easy to see, at a glance, how actual results compare to the plan. When it comes to Key Metrics, it doesn’t get more key than measuring Gross Margin or Net Income as a percentage of sales.
Key Metrics: Measuring per BBL
Another useful way to present income statement metrics is on a per barrel (BBL) basis. This can be measured in barrels brewed, packaged or sold.
To do the calculation, take total sales dollars for a period of time (month, quarter, year) and divide by the total barrels brewed (or sold) for the same time period. Repeat this calculation for each line item on the summary income statement.
Here’s an example:

The chart here shows each income statement line item on a per BBL basis. This allows for simpler goal setting and comparisons to past results. For example, if the financial plan calls for revenue of $375 per BBL, you can quickly see if you’re falling short.
As with percentages, measuring on a per BBL basis is like financial shorthand. This technique makes it easier to see how you are doing compared to the plan or past performance without having to dig through pages of financial reports.
The chart also breaks down the metrics by line of business: taproom, self-distribution, and wholesale. This is a useful way to look at the numbers and measure how each business unit performs (or underperforms).
Key Metrics: Portfolio Margins
In the example above, we see how beer margins can vary greatly by market channel. Self-distribution margin is twice as much as wholesale margin (and taproom margin is twice as much as self-distribution margin).
Moreover, beer margins can vary greatly by package and style. Kegs, cans and bottles all have very different costs and pricing structures. To highlight these differences, let’s create key metrics around portfolio margins.
Start with sales and margins by kegs and package beer. Below is an example:

The chart presents the information on a per BBL basis, and compares the relative sales, margin and margin percentage of kegs and packaged beer. In this example, the total margin dollars are similar, but the margin percentage is much higher on kegs. This is useful information to understand when analyzing your portfolio sales and margin mix and determining how sales of one product over another will affect financial results.
Results will vary, but this approach is a useful exercise to quantify the different margins in your portfolio. Start high level by measuring margins on kegs and packaged beer, then dig deeper into margins by cans and bottles and individual brands.
Calculate the Revenue/BBL and Margin/BBL and analyze the results. The metrics may surprise you.
Wrap up + Action Items
Key metrics should be used to track, measure and improve financial results in your business.
To get started, figure out what is most important to improve upon in your brewery. Use the focusing questions: What keeps you up at night? What is one problem that you need to solve? (Hint: it’s usually that problem you’ve been avoiding for months, or even years.)
Once you identify your metrics that matter, put together simple scorecards to record the numbers. Use percentages to simplify the numbers further or show the information on a per BBL basis. These percentage and per BBL measurements serve as financial short-hand and will make for easy comparisons to past results or future goals.
Key metrics are little numbers that can make a big difference in your brewery. Borrow from the metrics presented here or build your own. Your income statement will thank you.


Comments are closed